

Taking Care of People & the Planet
Climate & Resilience
Addressing carbon emissions and adapting to climate‑related impacts support long‑term resilience and a healthy environment. Our approach integrates emissions reduction, preparedness and resilience across our operations and supply chain.
We have set a goal to reduce Scope 1 and 2 emissions intensity by 25% by 2033, from a 2023 baseline of 24 tCO₂e / 1,000 ft² (to approximately 18 tCO₂e / 1,000 ft²). Since then, we have made progress, reaching 20 tCO₂e / 1,000 ft² in 2025.
Risks & Opportunities
Weather and climate‑related conditions can affect how our business operates. Extreme heat, storms, wildfires and other weather events can disrupt store operations, deliveries and access to fresh food. These physical risks can vary by location, depending on where our stores and suppliers are located.
We also recognize transition risks, which relate to how our business adapts over time. These can include changes in energy costs, evolving regulations and expectations from customers, investors and suppliers. Adjusting to these changes can require new investments, but they can also create opportunities to operate more efficiently.
Because our business spans many regions and relies on fresh products, understanding both physical and transition risks helps inform how we plan and prepare. At the same time, addressing these risks creates opportunities to improve efficiency, reduce emissions, strengthen operations and build more resilient supply chains.
Building Resilience
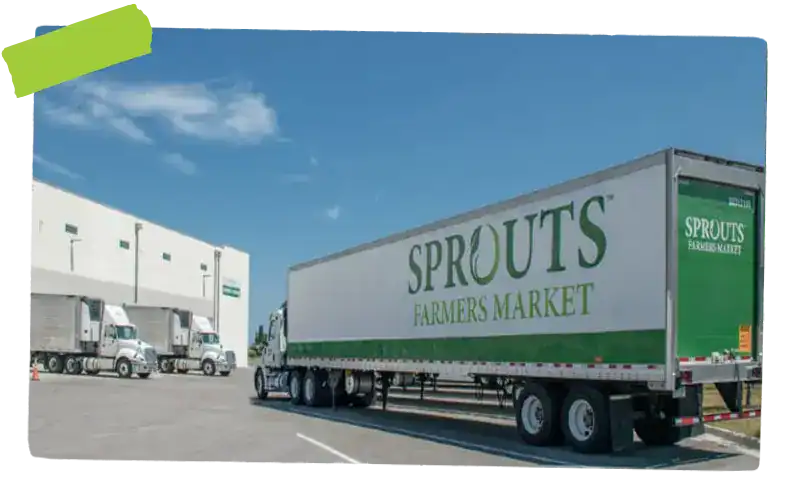
Building climate resilience means being prepared for weather‑related disruptions and changing conditions that can affect how we operate, while also investing in low‑carbon technologies that support long‑term efficiency and emissions reduction. Our focus is on strengthening day‑to‑day operations and supply chains so we can continue serving customers during challenging conditions. Across our business, this includes planning for extreme weather, improving the reliability of stores and distribution and working to reduce disruptions to transportation and product availability.
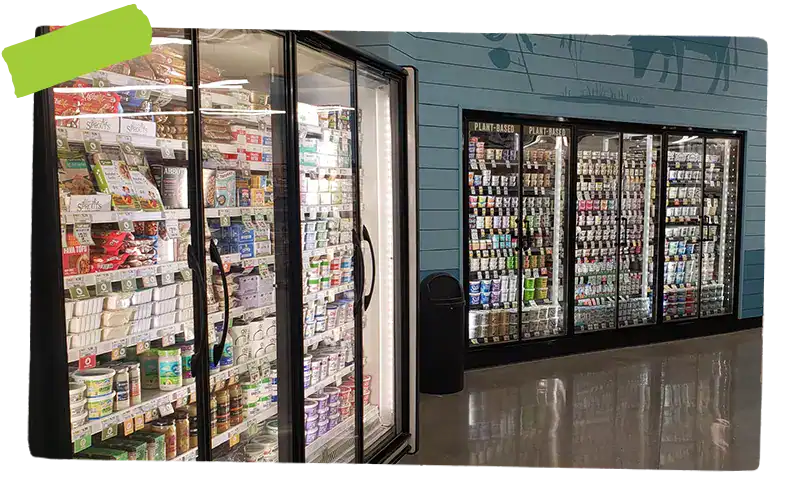
We also invest in upgrades to key store systems, including lighting and refrigeration, that improve efficiency while reducing greenhouse gas emissions. For example, in 2025 we completed our transition to 100% LED lighting across our stores, supporting lower energy use and more reliable operations. We have also focused on reducing refrigeration‑related emissions by improving leak detection and response, helping identify and address issues earlier. In addition, we have expanded the use of ultra‑low GWP CO₂ refrigeration systems, now operating in 30 stores, and plan to continue increasing that number over the coming years.
Because our operations span a national footprint, we take a flexible approach — using local insights, regional planning and lessons learned from past events to inform how we prepare and respond. By focusing on preparedness and practical investments, we aim to maintain consistent operations, support food access during extreme weather events and strengthen our ability to adapt as conditions continue to evolve.
Emissions & Energy Use
Tracking emissions and energy use helps us understand where we can improve efficiency, manage costs and reduce environmental impacts across our operations. We monitor greenhouse gas emissions from our stores, distribution centers, equipment and supply chain, and use this information to inform planning and operational decisions.
Greenhouse Gas Emissions (tCO₂e)
| Metric | 2023 | 2024 | 2025 |
|---|---|---|---|
| Total GHG Emissions | 2,715,878 | 2,484,884 | 2,592,754 |
| Scope 1 | 139,735 | 123,096 | 124,659 |
| Scope 2 - Market | 127,131 | 137,952 | 129,014 |
| Scope 3* | 2,449,012 | 2,223,836 | 2,339,081 |
| Scope 1 and 2 | 266,866 | 261,048 | 253,673 |
*Scope 3 emissions are estimated using a combination of supplier activity data and modeled emissions factors. Year‑over‑year changes reflect both business activity and methodology/model updates.
Energy Consumption
| Metric | 2023 | 2024 | 2025 |
|---|---|---|---|
| Electricity (MWh) | 353,145 | 385,904 | 411,783 |
| Natural Gas (MWh) | 180,569 | 187,387 | 197,575 |
Intensity Metrics
| Metric | 2023 | 2024 | 2025 |
|---|---|---|---|
| Scope 1 & 2 Carbon Intensity (tCO₂e / 1,000 ft²) | 24 | 22 | 20 |
| Total Carbon Intensity (tCO₂e / 1,000 ft²) | 240 | 205 | 200 |
| Total Carbon Intensity (tCO₂e / $M revenue) | 397 | 322 | 294 |
| Energy Intensity (MWh / 1,000 ft²) | 47 | 47 | 47 |
| Energy Intensity (kBtu / 1,000 ft²) | 161 | 161 | 160 |